Learn how to analyze data with SharePoint and InfoPath using Power BI or Power Query in this step-by-step instructional post.
System requirements:
- SharePoint Server; SharePoint Online
- Excel 2010 and beyond Or Power BI
- InfoPath Designer
Despite Microsoft’s attempts to retire InfoPath from the newest versions of SharePoint, the form designer tool persists and is still widely used across SharePoint sites.
As we all know, its popularity is due to the ease of use and the frequent need to present e-forms with built-in intelligence without code.
Repeating tables are one of the popular features of InfoPath. The challenge however is to extract the content of the tables for reporting and analysis.
This can be achieved using Power Query or Power BI and the form library as a data source.
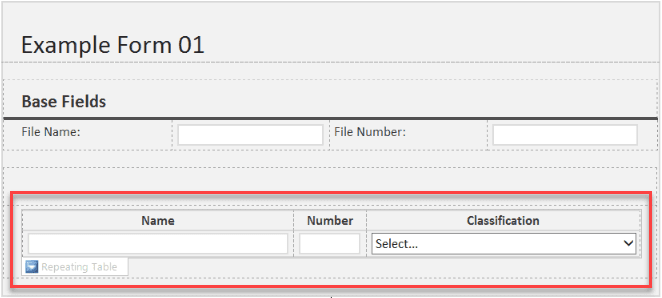
The example InfoPath form below contains a repeating table or repeating section.
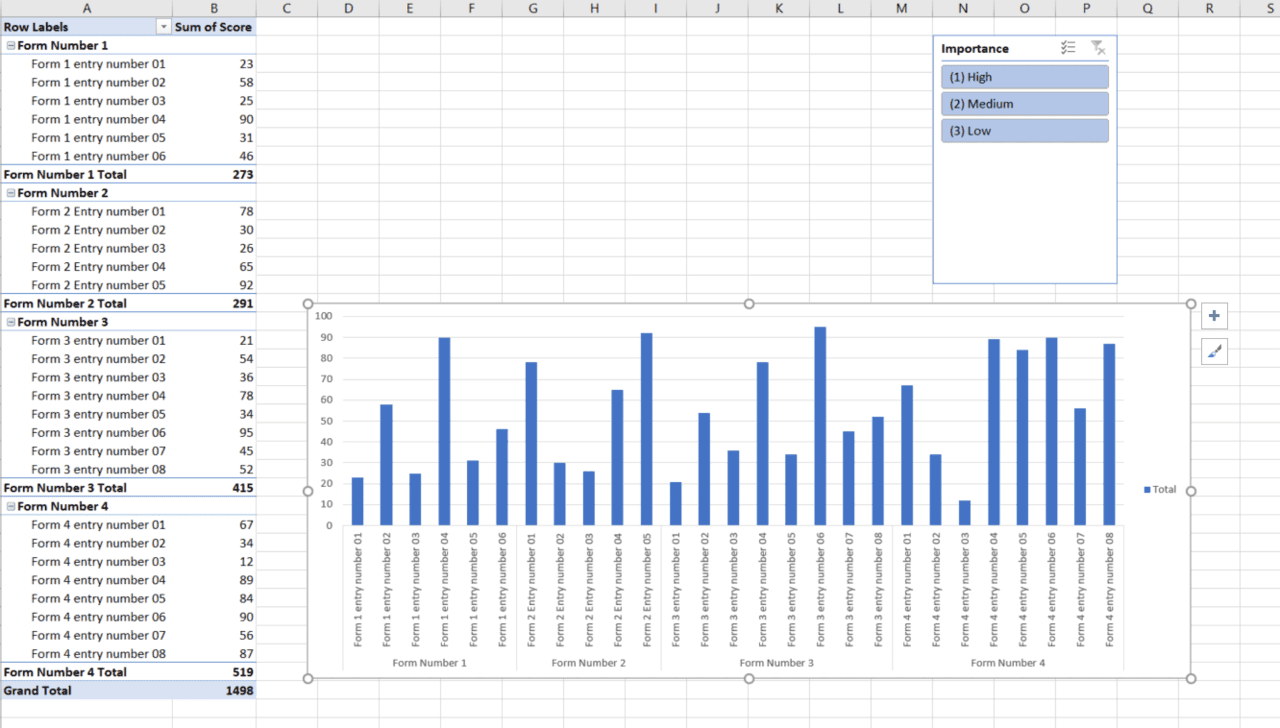
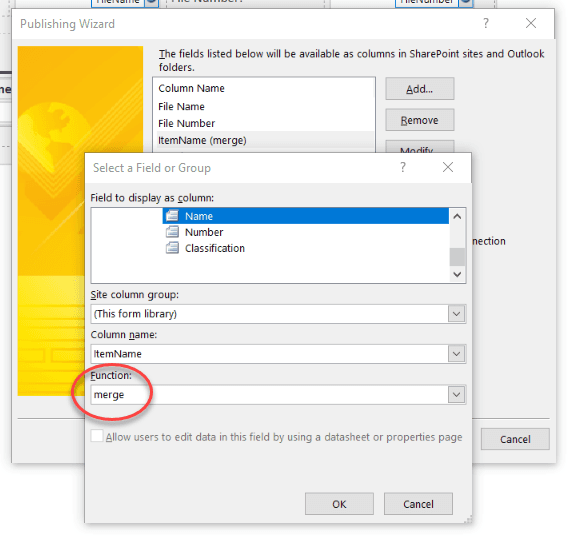
When publishing the form to the SharePoint library, using the publishing wizard, the repeating table fields should be published as merged columns of the form library. You should only add the columns that will be required to create the required report. Our goal here is to create a report, graphic or otherwise in Excel or Power BI that will look like this using all 3 columns of our repeating table.
Publish all 3 columns using the setting shown below.
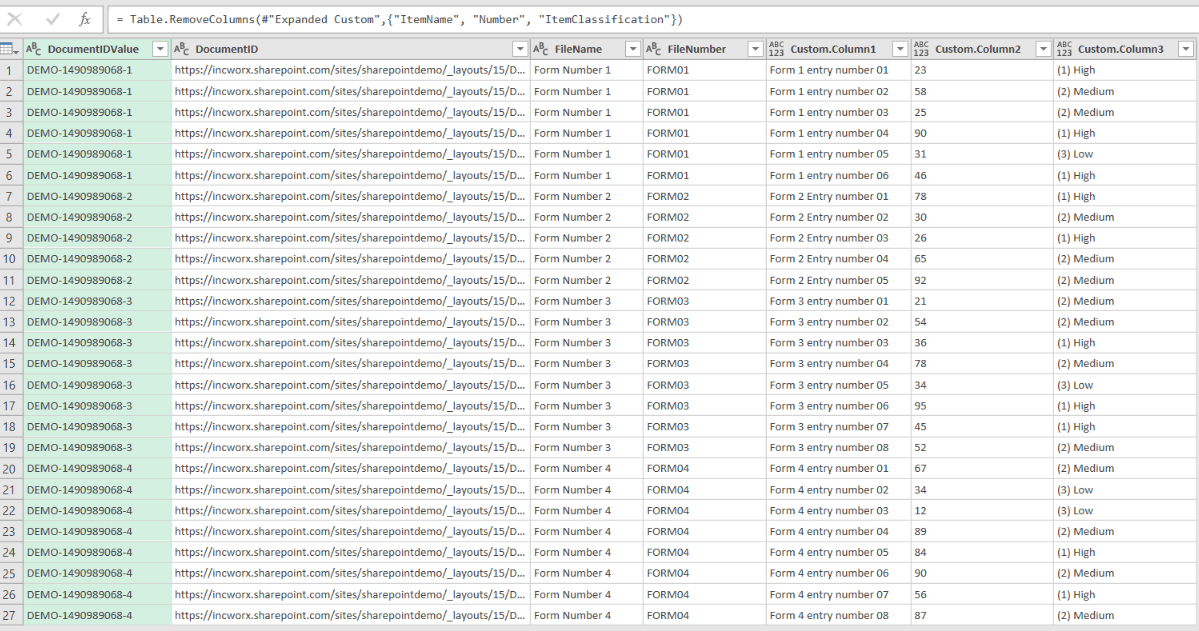
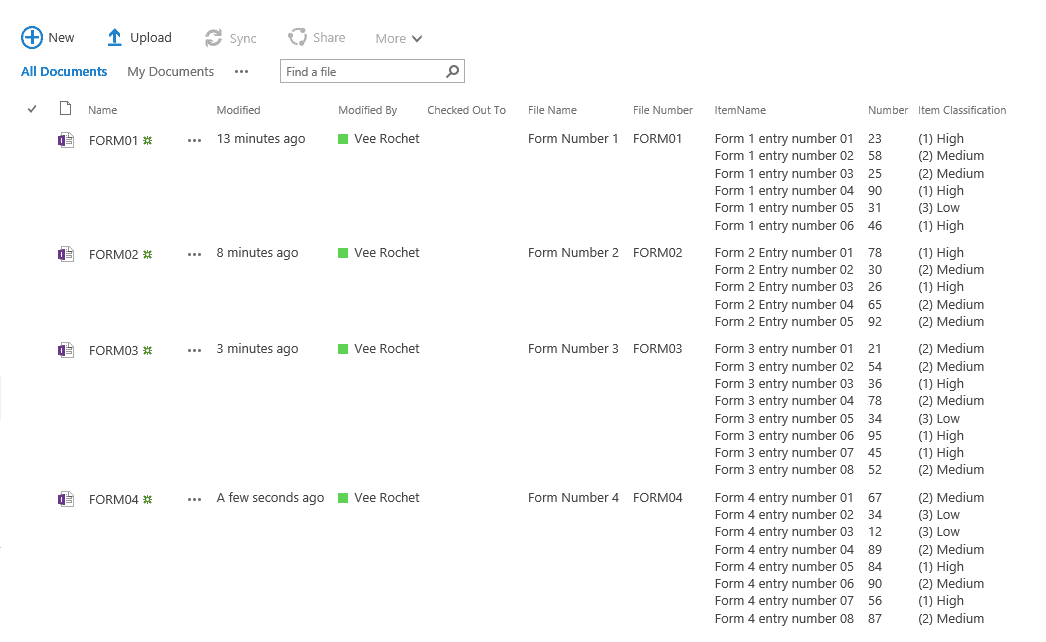
Once published, the data contained in the repeating table will be shown as in the picture below.
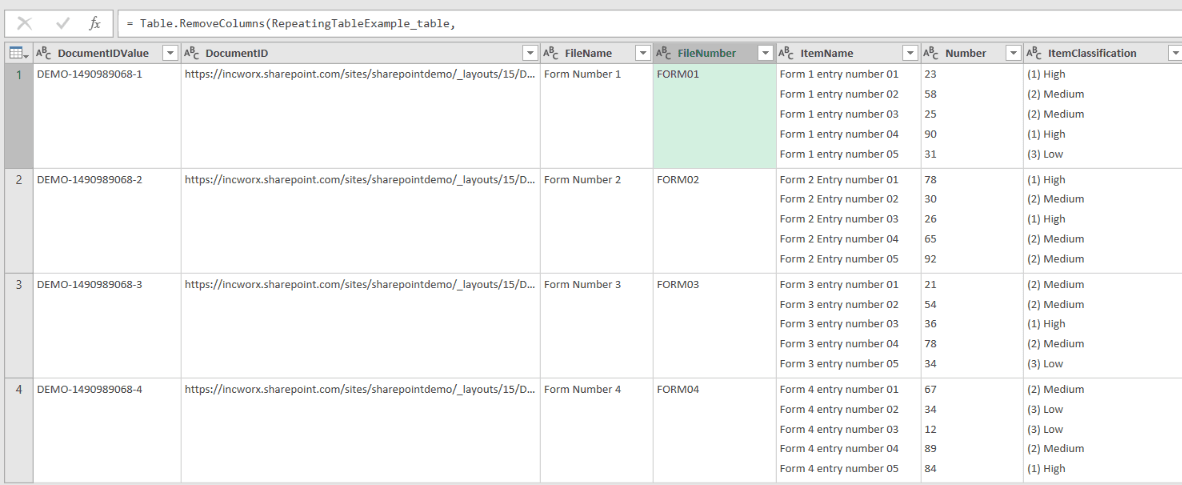
In order to analyze the data as single separate entries, we need to create a connection to the document library using Power Query.
Once connected to the SharePoint Library in Power Query, we need to split the merged values between the Item Name, Number and item Classification columns into separate rows.
We add 3 new columns using the following formula in a new column of type table using the Text.Split function:
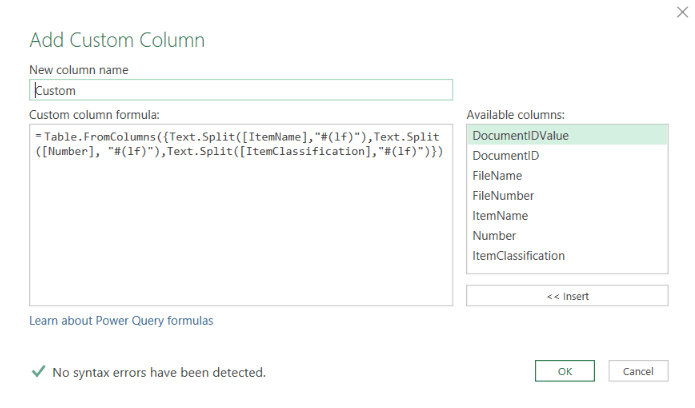
This formula will create the following custom column:
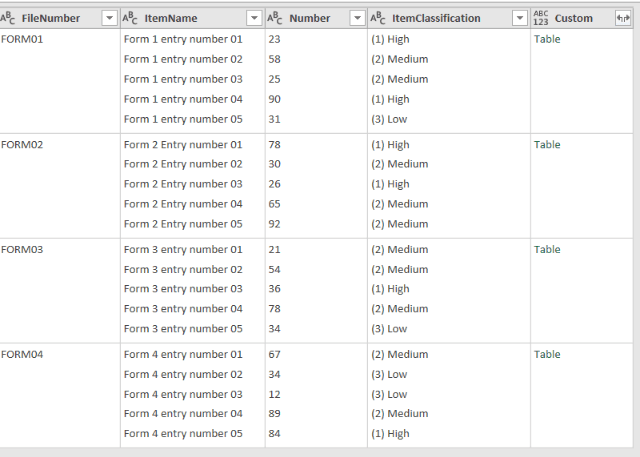
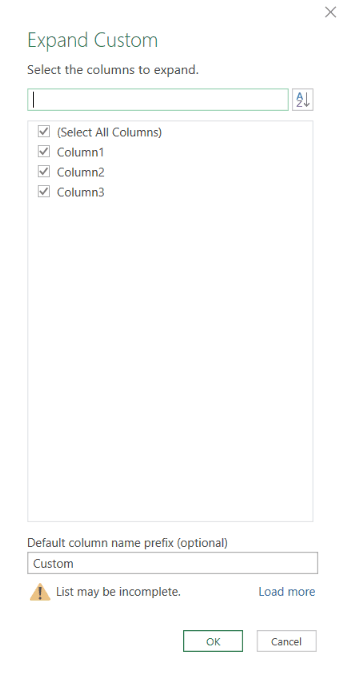
The next step in the query is to expand the custom column we just created:
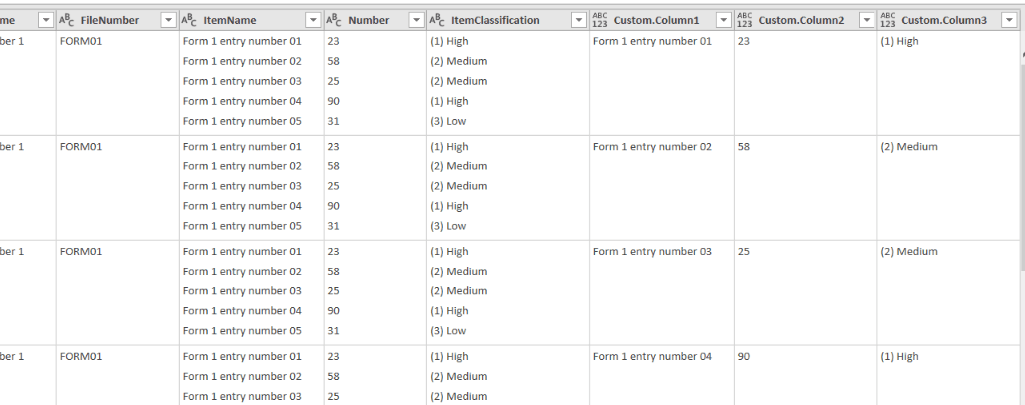
After expanding the column, each entry is added as a row:
The last step is to clean the query by deleting the original columns and any other steps required to obtain the query needed for the report.